Case for Continuous Improvement
In The DevOps Handbook the authors make a case for teams spending at least 20% of their time towards reducing technical debt.
The deal [between product owners and] engineering goes like this: Product management takes 20% of the team’s capacity right off the top and gives this to engineering to spend as they see fit. They might use it to rewrite, re-architect, or re-factor problematic parts of the code base…whatever they believe is necessary to avoid ever having to come to the team and say, ‘we need to stop and rewrite [all our code].’ If you’re in really bad shape today, you might need to make this 30% or even more of the resources. However, I get nervous when I find teams that think they can get away with much less than 20%.
I am going to abstract this to suggest that all teams should spend at least 20% of their time improving the way they work. In the case of the team I work with, we produce documentation as well as some proof of concepts to demonstrate the effectiveness of our proposed ideas. After work one day, I was discussing modelling our team as an Enabling Team, from Team Topologies, with a colleague. In the book they recommend that an enabling team could spend time assisting other teams in onboarding new technologies, or helping other teams find better ways to work. My colleague challenged me on our ability to sell ourselves as a learning team. People are busy, why would people want to slow themselves down by committing time away from their priorities to improve? How would you sell that to a team already working at 120% capacity?
Many of us already know from the Phoenix Project the hand wave anecdotal justification for committing time to improving one’s process. If one was really taken with the Phoenix Project they may invest the time to learn more by learning the magic of DevOps through books such as The DevOps Handbook (which I suggest you do). However, if you’re in a position where you need to quickly make a business case for continuous improvement, how does one do this? That is what I will try to do here. Make a succinct argument using some simple math to demonstrate the value of continuous improvement.
TLDR
The TLDR of this article is that ‘continuous’, in more formal terms, means compounding. Or, depending on your preferred jargon, exponential. If you graph output with the Y axis as ‘units produced’ and X as time, then the team that continuously improves will increase their output exponentially. And given some arbitrarily large value n (or as n approaches infinity) then exponential will always beat linear. Given that our teams exist for some arbitrarily long time (n), then teams who continually improve will be more productive than a team who does not.
If that sounded a little math-y or jargon-y, we’ll walk through it below.
The Case for Continuous Improvement
This demonstration was created using the fantastic site, desmos.
If we graph f(x) = x we will get a line as follows
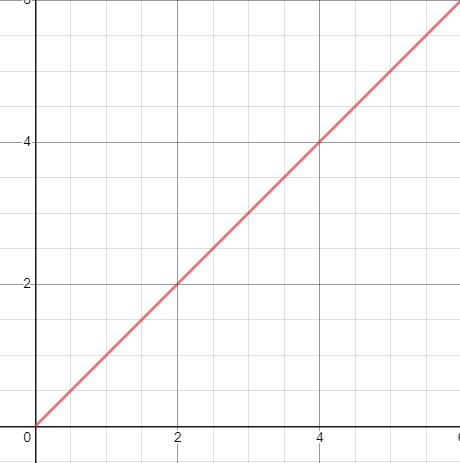
We are defining y-axis (the vertical one) as the total units of business value produced, and the x-axis to be time. The line then is the total units of business value produced over some unit of time. For the sake of this example, let’s say that each increment in x is one month.
This line assumes that, week after week, the team continues to do work “as usual”, or the famous “we’ve always done it like this” approach. With this approach, the team will (on average) produce the same units of business value each week. If you are working over 100% this week, you will be next week too.
What’s the alternative? Continuous improvement.
If we continue to improve our processes and tools week after week, we will continuously improve, thereby becoming able to produce more business value over a given time. This should give us an exponential curve, which looks something like this
f(x) = x2
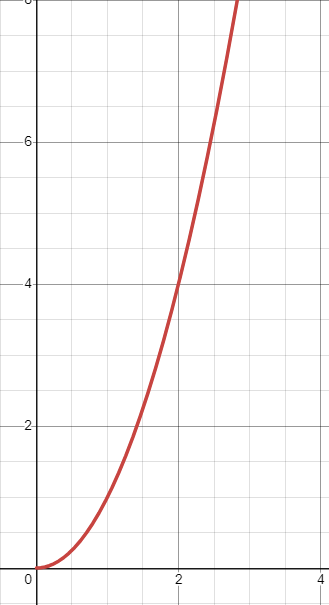
The most obvious thing we notice is that the exponential function grows much faster. One may counter, however, that there is an initial loss of productivity if one spends time improving rather than actually doing work, so we must account for this. To do this, we must subtract some value from f(x) to account for the lost productivity. For each increment in time, then, we will lose some percentage of our time. Where x represents time, this can be written as
x * [some percentage of productivity lost]
Or, to be more succinct, we can replace [some percentage of productivity lost] with l. Then we will have
x * l, where l is the amount of time spent per day on improving.
With this addition, we have
f(x) = x2 - (x*l)
What happens when we graph this? Well, let’s assume we spent 20% of our day on continuous improvement. Then we lose 20% of our productivity per month.
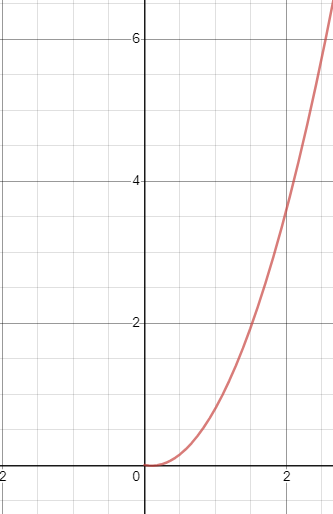
Notice at the bottom that the curve flattens out slightly. This decrease in productivity is always present as x (the amount of time) increases. However, an exponent will always beat a linear progression. The next obvious step would be to then graph our “as is” way of working versus our continuous improvement method of working, and see how long it would take before a continuously improving team will take before it is more productive than the team who continues to work the same way, day after day. Before that, however, in our previous calculation we used x^2, which is a curve that grows very quickly, and up until now, we have not justified our selection of the arbitrary value of 2. Another way we could have written this is
x2 = x1+1
When talking about percentage points, we calculate using decimal points. Therefore, 1 = 1.0 = 100%. Therefore, as we had it written previously we are claiming that our productivity increases by 100% per day! If anyone has figured out how to do this, we’d love to hear from you! Unfortunately, if you live in the realm of mere mortals like me, 100% productivity increase per day is likely unattainable.
We can rewrite our productivity increase function as follows
f(x) = x1+[the amount of productivity increase we expect per month spent continuously improving]
That’s really long to say, so if we set [the amount of productivity increase we expect per month spent continuously improving] = r, then we have
x2 = x1+r
Where r is some percentage of increased productivity.
Alright. We’re almost there! Our function for mapping how productive a continuously improving team looks something like this
f(x) = x1+r - (x*l)
- Where r is equal to the rate of improvement
- And l is equal to the amount of time we have spent continuously improving
Next we will pick some values that make sense. As discussed, in The DevOps Handbook they recommend %20 of your time be spent on reducing technical debt or process improvement. So for l we will pick 20%, or 0.2
Now how much improvement do we expect from 20% of our time being spent on improvements? As a government employee, I know in certain cases this return can be gargantuan. For example, Estonia claims they save 820 years of working time annually through their use of automated digital services. For our example, however, as we will see, the rate of improvement is not all that important. You will always eventually become more productive if you continually improve for long enough. Alright then, let’s choose 10%, which is the same as 0.1. So we are assuming for each unit of time for which you spent 20% of your time, you get half as much efficient for the time invested. Conservative, at best. Our function then becomes
f(x) = x1+0.1 - (x*.2)
f(x) = x1.1 - (x*.2)
And if we graph this, we will get the following curve
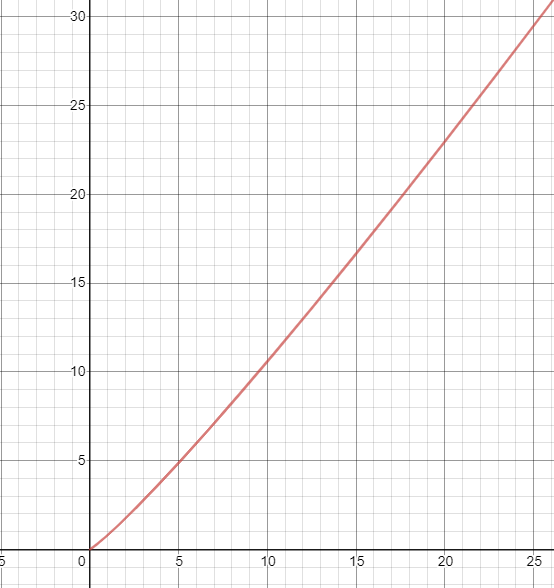
Great! What’s next? Well, let’s say we compare that with a team that does not continually improve, and continues to grind through, day to day, doing things “as they’ve always done them”.
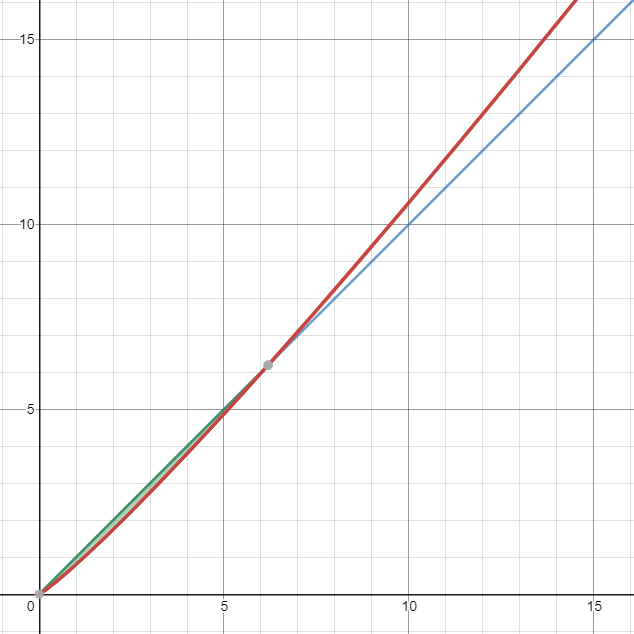
We can see that the red line, which represents the team that continually improves for 20% of their day for a small 10% return in productivity will be more productive in about 6 months (or 6.192 months, to be exact). Even if you reduced the productivity gained by half (to 5%, or 0.05), you would still find that before 39 months is up the team that continuously improves will inevitably end up outperforming the team who does not.
We have demonstrated that even if the trade off between time invested versus potential gain is low, if one continually improves their team then over time they will become more productive than the team who does not.
Imagine if they had started continually improving years ago, think about how productive they would be by now! Don’t make the same mistake our predecessors did. Start continuously improving now! Your future team members, future bosses, and your future self, will all thank you.
To satisfy the purpose of this article, one may stop here. If you would like to play around with some numbers on desmos please click here. If you’re interested in further details, below we are going to talk about how to decide on the optimal trade off between productivity gained and time invested.
The End
Thanks for reading! This was my attempt at going from simple to more complex in an attempt to try and more formally and rigorously define the logic behind committing to continually improving. In the first part of this document The Case for Continuous Improvement I was hoping to provide a easily consumable and succinct pitch for folks to start continuously improving without requiring them to read all the books… though it would be best if they did. It only requires one to remember a little from the dusty math books. The next post is intended for the more committed reader to try and more deeply explore the outputs desired from continually improving, and what we should take into consideration when doing so. This blog post was a blast to write.
Thanks for reading!
Edited on 2019-11-13:The Deeper Dive section has been moved to a following post to shorten the length of this article and the conclusion has been adapted to better represent this new structure.
Edited on 2020-01-01: The post was edited to add the main author.