Funding Software Related Activities
In this blog, we attempt to clarify the difference between project and product management by highlighting which software-related activities need funding throughout a product’s life.
Note: This blog will link to internal ESDC documents, which are unfortunately only accessible within ESDC corporate network.
We’re doing this to reduce some frictions we’ve observed that makes it difficult to implement product management in government.
Although a product may not necessarily be software-based, we associate the current hype towards product management with our transition towards digital. Digital means that software is a medium for service delivery which, because of its unique properties1, offers an opportunity to drastically reduce the feedback loop between policy and delivery.
And so, to effectively understand product management in the digital age, we need to understand which “activities” are being performed on software. And by “activity,” we mean “a piece of work requiring funding.”
We can categorize those activities as follows:
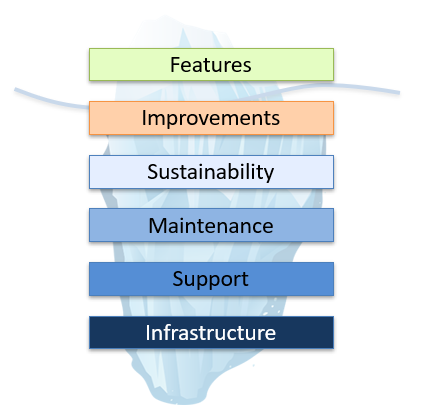
Features: the raison d’être of the software product and what “the business” focuses on. Where discovery work, user research, and development are being done to obtain a benefit.
Improvements: avoiding entropy by continuously improving user experience, business process performance, and cyber-security postures (e.g., architectural design patterns).
Sustainability2: maintaining software currency and sometimes technology refreshes (e.g., moving from PowerBuilder to a more modern technical stack). This especially points to the updated Directive on Service and Digital’s requirement to maintain a “minimal attention required” IT assessment value.
Maintenance: software patching (e.g., addressing CVEs3)
Support: bug fixing, outage remediation, disaster recovery, help desk support, and documentation.
Infrastructure: public cloud subscriptions, Shared Services Canada (SSC) managed servers, COTS proprietary licences.
Using those 6 types of activities, it should then be possible to forecast a budget to not only create but to maintain a product’s value over its life span. For example, by extrapolating a reasonable budget using the number of servers employed, the different components, cloud services, and technical stacks making up the software product, vendor roadmaps if commercial software is used, size of the end-user base, etc.
If we map those activities over a product’s life span, we can expect them to fluctuate over time.
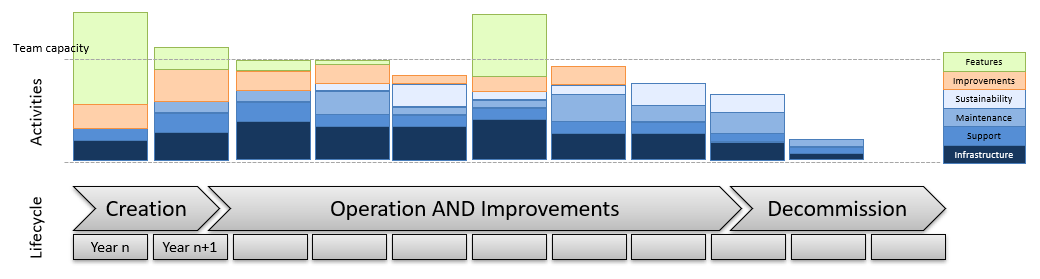
At the beginning of a product’s life, the focus is on feature development. But over time, the efforts on features should diminish, with a transition to focus on continuous improvements and activities typically associated with technical debt.
A team’s capacity is therefore expected to also fluctuate. In the beginning, the product team (or the project team if a product team does not yet exist) will need to temporarily boost its capacity to meet demand. After some time however, a reduction in demand means it is likely the product team will be managing more than one product to justify its budget.
In the middle of Figure 2, we represent additional demand for features coming from a project (e.g., as a response to a new legislation change). The demand may warrant the product team to temporarily boost its internal capacity to supply that demand, especially if a rollout date has political consequences.
This is an important shift in perspective between product-focused vs project-focus in government. Projects still exist, but they become an instrument that brings demand to product teams, and which necessitates obtaining permission to use additional funds. It’s then the role of the product manager to negotiate with the different project managers on what is reasonable for the product team to do in a given time horizon. The product manager ensures the team is equipped for success, so if the team needs to temporarily increase its capacity, it’s the product manager that secures funding to hire more staff (e.g., from funds that a project received permission to use, or via funding pressures to the department).
Regarding the creation of products, if it’s small enough, an existing product team may have sufficient capacity to manage and oversee its creation, including giving sufficient assurance to senior officials about policy compliance. But at a certain scale we foresee that a project will most likely be necessary to secure commitments and provide needed assurances to senior officials. This is because project management is typically the instrument used to obtain temporary additional funding, engage in Treasury Board (TB) submissions, and engage other functional expertise (e.g., Enterprise Architecture, Privacy, Security, Legal, Accessibility).
However, passing the TB mandated gates does not necessarily mean that we must use a “waterfall” approach4.
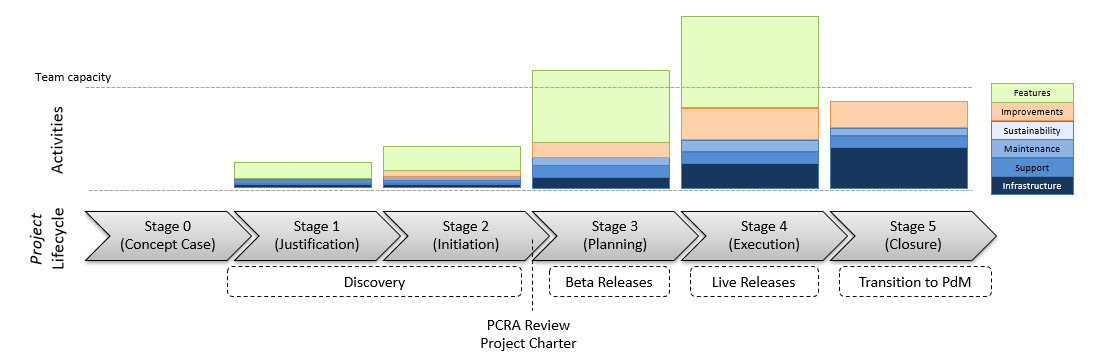
At ESDC, an “investment project” is the term used for gated projects. Major Projects (typically, projects above $5M), have 6 decision gates in their lifecycle.
Feature-related work should be done during stages 1 and 2. This includes performing discovery work such as user research, sandbox experimentation, prototyping, and even alpha releases. This means engaging product developers, not just Enterprise Architecture, to better understand what we’re getting ourselves into.
This discovery work is necessary to correctly inform the Project Complexity & Risk Assessment (PCRA), a TB mandated gate 2 deliverable. Looking at the PCRA, 2 of its 7 sections make up 51% of the total score.
| Section | Max Score | % of Total |
|---|---|---|
| Project Characteristics | 90 | 28% |
| Strategic Management Risks | 30 | 9% |
| Procurement Risks | 45 | 14% |
| Human Resources Risks | 25 | 8% |
| Business Risks | 25 | 8% |
| Project Management Integration Risks | 30 | 9% |
| Project Requirements Risks | 75 | 23% |
| Total | 320 | 100% |
‘Project Characteristics’ is made of the budget, project size, duration, technology scope, and number of stakeholders.
‘Project Requirements Risks’ includes degrees of certainty and the complexity of requirements.
Involving product developers who are knowledgeable about the product during the discovery phase will aid in minimizing project risks, lend credibility to the TB submission and/or Project Business Case, but more importantly increase the likelihood of success for the overall project. This requires spending funds for IT personnel, not just architecture, before the planning phase.
Then passing gate 2, we continue to iterate using beta, followed by live releases. Decision gates are still used to assess whether the investment remains relevant. It’s at the end of the project that a transition towards product management is made. This is because access to funds that the project authorized will end, and so a different source funds will need to be secured for the long-term lifecycle of the resulting product(s).
If you’re in a product team doing software-related work, you probably only see those 6 activities, regardless of whether they are part of a project or not. This may be where the confusion between project and product in government lies as product developers may not see, or even be aware, of the greater departmental oversight and machinery of government happening.
In addition, different expertise will be necessary depending on which activities are being performed, which can affect a team’s composition over time (e.g., at the beginning of a product’s life, UX expertise would be prioritized, and then move towards focusing more on software development and site reliability engineering (SRE)).
Those 6 activities can then be used to justify budgeting for a product team over a time horizon.
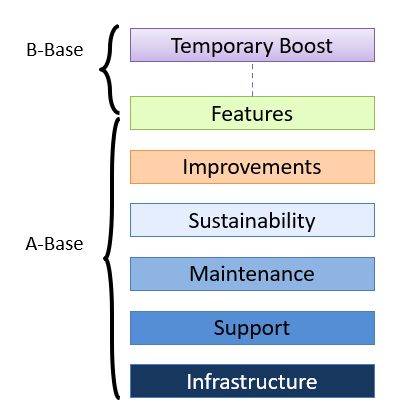
B-Base funding (temporary boosts) would typically come from investment projects that obtained permission to use funds. But A-Base funding should be justified by explaining the different kinds of activities that are necessary to maintain a product’s value over time and represent the reference levels for a product team. This A-Base is necessary to provide stability for product teams and enable product management.
Lastly, product teams need to be multi-disciplinary. The traditional model of “the business” sending demand over to “IT” as though it’s a separate company providing software development services make it extremely difficult to adopt product management. In a previous post, we extrapolated how a line of business could sponsor IT staff in order to form a multi-disciplinary product team and explain how different product teams interact with each other using team topology concepts.
Hopefully, this blog resonates with government personnel striving to move towards product management. However we want to call it, difficult prioritization decisions need to be made given limited resource capacity. Product teams need to be able to justify their long-term budget in order to then be able to properly engage in product management.
-
Unique properties of software: its elasticity, its broad reach, and the large amount of data generated from interactions with it ↩
-
The sustainability activity is inspired by the Canadian Revenue Agency’s (CRA) Sustainability Program ↩
-
CVE = Common Vulnerabilities and Exposures ↩
-
Inspired by both Transport Canada’s How We Work, and the Digital Experience and Client Data (DECD) team in the Business Delivery Modernization (BDM) Programme ↩