Implementing Product Management
This is a DRAFT strategy.
Note: This page will link to internal ESDC and Government of Canada (GC) Network documents, which are unfortunately only accessible within ESDC or GC corporate network.
Table of Content
- Introduction
- Definition of Product
- Why We Need This
- Conceptual Product Management Framework
- Phase 1 Implementation
- Appendix A - Product Architectural Boundaries
- Appendix B - Level of Autonomy
- Appendix C - Product Life Cycle Overview
- Appendix D - Portfolio Management, a CFO’s perspective
- Appendix E - Value Stream Mapping
- Appendix F - IT’s Financial Model
- Appendix G - Terms and Definitions
- Appendix H - Change Log
- Notes
Introduction
Purpose
To provide the ESDC with a new type of investment: Products1.
This is to raise awareness and provide incentives to ESDC Programs that they need to seek sufficient funding for their digital operations (rooted in the Policy on Results)
Phase 1 of the strategy is a 1.5-year Branch Initiative, salary based, to produce an MVP Framework2 and evaluate it against 2 product candidates.
Expected Benefits
Benefits are not realized after a framework is produced, but rather after a series of change management activities have been completed to operationalize and use the framework. Phase 1’s goal is to inform this set of change management activities as a programme-like plan for a Phase 2.
Once realized, we expect the following benefits to ESDC:
- Increase service improvement cadence
- Release internal IITB capacity towards innovation
- Timely prevention of technical debt
Scope and Target Audience
The scope of this strategy remains within the authorities of the department (e.g., we are not seeking to change Treasury Board (TB) procedures or laws).
The main Target Audience for Phase 1 is the Chief Financial Officer (CFO)3 and the Chief Information Officer (CIO)4 as the strategy seeks to make modifications in their respective domains. In addition, we are seeking contributions to teams involved in transformational change management for the greater awareness campaign.
A complete list of the stakeholders are listed here.
Definition of Product
We need to use two different levels for a product definition5:
Departmental Level: An offering, tangible or intangible, delivered to a Canadian as part of ESDC’s Program mandate.
(e.g., a licence, a benefit, a passport, a digital ID, a Grant, a Job Offering)
Note 1: Departmental products aligned to the Departmental Results Framework (DRF), in particular within the Program Inventory within the DRF.
CIO Level: A software or hardware solution that is developed to improve a business capability (internal product) or improve a user experience (external product).
(e.g., Job Bank, MySCA, Payment Management System)
Note 1: A software solution is one or more Applications as defined by the Application Portfolio Management (APM) Program).
Note 2: A software solution has clear Architectural Boundaries.
Why We Need This
To meet Policy on Results expectations, ESDC Programs require a Digital Infrastructure. This because Canadian expectations have changed, as codified in the new Policy on Service and Digital.
Today, “Digital” is still considered an internal service in a departmental Program Alignment Architecture. This gap affects programs’ ability to deliver and does not promote the needed shared accountability between Program Officials, the CIO, and the CFO.
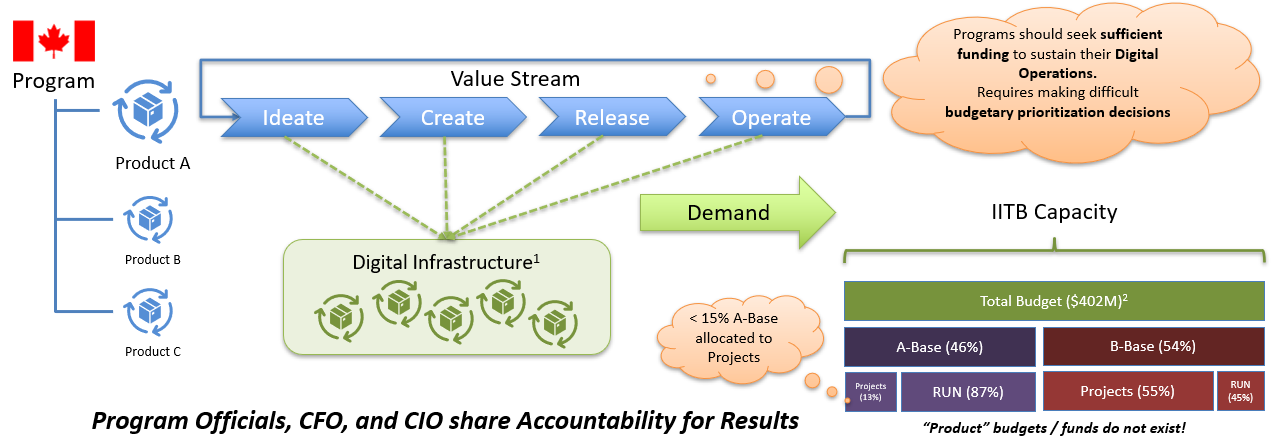 Figure 1. Departmental products are tied to the Program Inventory. And the CIO-level products are used in their value streams.
A departmental product’s value stream expects to leverage a digital infrastructure, either for its internal staff or as a delivery method to Canadians. This digital infrastructure is no longer just a back office, but the face of government for Canadians.
There are a few problems with our current mode of operations:
- Program renewals do not include sufficient attention to the digital infrastructure it now needs to operate. Digital is not just an internal service offering, it’s a “reset of policy, delivery, and evaluation”.
- Programs demand for digital infrastructure keeps increasing while CIOs and CFOs keep needing to prioritize their limited A-Base resources, affecting Business and IT synergies.
- This prioritization of limited resources is heavily dependent on timely funding allocation from programs to sustain the digital products it offers. Our current funding model does not allow rapid release of funds and the methods used to manage them (projects and programmes) promote risky behaviours.
The Policy on Service and Digital requires ALL ESDC SERVICES to continuously be improved.
Digital converges multiple domains together: Policy, User Experience (UX), Delivery, and Technology. The traditional investment methods to formalize this engagement are with Projects and Programmes. We seek to add a new method: Products.
| Method | What it's about | Its effects |
|---|---|---|
| Project |
|
|
| Programme |
|
|
| Product |
|
|
This new Product investment type is to give sufficient incentive to Programs in incorporating digital as part of their periodic funding envelope review. The incentive offers more autonomy to operate as long as a Product Team can provide sufficient assurances to Governance.
Note 1: Programmes are typically used when there’s a level of ambiguity to manage. However, the lag in establishing a programme inhibits the rapid cadence that continuous improvement of a product seeks, especially on the User Experience side. When a product is used, data is generated which can be analyzed to inform continuous improvement activities. User Feedback is obtained and actioned. The improvements are often small enough that the effort to go through establishing a programme does not warrant it.
Note 2: Projectizing establishes a project team which is disbanded at the end of the project. The team members that obtained valuable corporate and product information move on to other activities. Even moving between Proofs of Concepts, then Pilots, then Projects does not guarantee the same team members working on problems. This affects empathy to the end users, productivity, happiness, and ultimately pace of delivery. It is what psychologist Bruce Tuckman coined the forming, storming, norming, and performing lifecycle. The product-type investment method focuses on the people being part of the value stream and seeks to maintain their cohesiveness.
Note 3: The department accepts to prioritize a product over a multi-year horizon by granting funding over more than one year. Teams do not have to go through committees year over year to re-seek prioritization and funding, therefore releasing internal capacity towards more meaningful work. There is an exit path for ESDC to still reallocate funding (its product team) elsewhere should priorities change without losing its investment.
Note 4: The Product investment type expects rapid cadence of delivery to end users. Planning stages do not last more than a few weeks so that changes in business operations (e.g., software release) are typically provided at least once per quarter.
Conceptual Product Management Framework
Seeking Product Status
A Program area (represented by a Director General (DG) or an Associate Deputy Minister (ADM)) may request product status to the CFO and CIO. Having “product status” means obtaining blanket funding priority over a time horizon for the particular product. A product managed as such do not need to seek yearly funding and priority approval as it is provided on a multi-year horizon.
- A Line of Business (LOB) ADM or DG presents a Simplified Business Case (the Product’s Roadmap).
- This Business Case is NOT your typical Business Case used to fund a project.
- The LOB ADM/DG, CIO, and CFO get into a Memorandum Of Understanding (MOU) by identifying:
- source(s) of funds
- level of autonomy
- expected budget
- the Product’s Architectural Boundaries
- the Product’s Value Stream
- the Product’s internal governance structure
- the time horizon sought for the blanket approval of priority and funding (in years)
- The Major Projects and Investment Board (MPIB)6 oversees investment arrangements and progress reporting
- Includes TB submissions, review of product status, and reporting requirements
Note 1: The LOB ADM/DG receives a known budget, but its funding distribution within her portfolio is managed by her.
Product Roadmap as the Investment Plan
The Product’s roadmap acts as the Investment Plan for the time horizon and is the basis for accountability.
Figure 2. The Product's Roadmap as the Investment Plan.
Business Outcomes are mini-business cases (typically 1 pager) and the definition of success for that roadmap step. Business Outcome deliveries also act as decision gates in the investment plan.
The blanket approval over the time horizon gives the product’s value stream stability. A budget may be augmented based on the desired Business Outcome(s) in the roadmap, at which point departmental governance needs to be engaged since budgets are a CFO domain. This budget ask is not based on historical spending levels but on future need.
The Roadmap can and will be re-prioritized. New business outcomes may be added or shifted on its timeline due to experience gained with the product and to changes in departmental or portfolio priorities.
The Roadmap is reality for the product team. Parallel projects feed the Product Roadmap’s backlog and their schedules are expected to be adjusted based on the changes in the product’s roadmap. This is because it is unrealistic for a product team to manage multiple commitments (e.g., Windows server upgrade, WLM, Accessibility Compliance Project, Technical Debt Programme, one or two Business Enhancements, Benefits Delivery Modernization, etc.). Instead, those commitments are part of the Product’s backlog and will be dealt with as part of the Product’s roadmap. Should reality changes (e.g., new priority affecting a product’s roadmap horizon), parallel projects absorb the change and adjust their schedules accordingly. Should those projects be sources of funds for a product, they are provided only when the Product business outcome plan includes requirements of such projects.
Note 1: It is expected that business outcomes are provided in short cadence (typically at least once per quarter). This so that the product-type investment is not held in a planning stage for too long and allows course correction within the time horizon.
Note 2: Work progress is tracked through different key metrics
Note 3: The short cadence requires moving towards Continuous Authority to Operate (ATOs)7 and Monitoring
Note 4: To accurately define business outcomes, LOBs are encouraged to partner with the Chief Data Officer (CDO) and the Business Architecture Alignment Office (BAAO).
Key Metrics to Provide Assurances
In a product-type investment, governance changes from an entity where one goes to seek permission to do work, to one that observes and may interject if necessary. A product team has blanket authority to do work while providing departmental governance with information on their progress.
Achieving a Business Outcome may not be a straight path. Product features are hypotheses that must be validated before we can claim victory. This may include a series of A/B testing, experiments, Proof of Concepts, using Analytics to interpret data and informing the next iteration of a product.
In a project-type investment, a schedule is the assurance provided to governance on progress because the planning phase sought certainty before execution can start. In a product-type investment, the following three key metrics are the assurance, expected to be produced by the Product team. These metrics are consumed by the Product Team, the Business Sponsor, and Governance (DGPOC/MPIB).
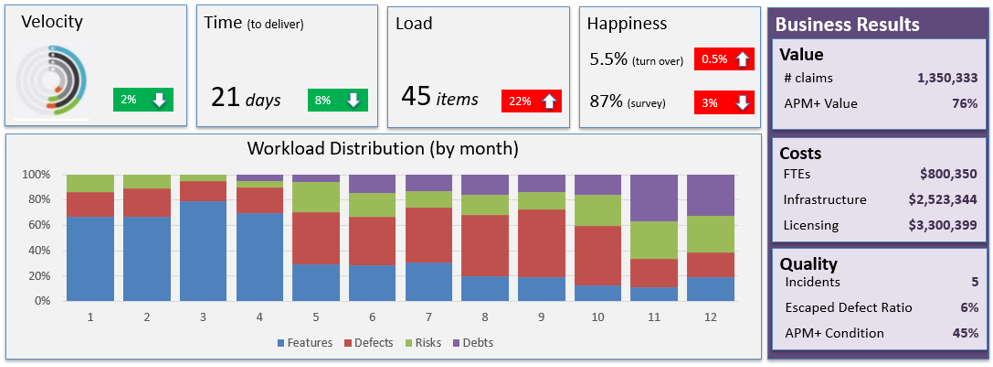 Figure 3. Three key metrics that Governance will use to measure progress.
- Health Diagnostic metrics are provided to address potential velocity issues in the value stream (e.g., creeping technical debt, lack of personnel, conflict between teams affecting moral).
- Workload distribution are provided for transparency.
There are four types of work:
- Features: What end users see. A new function or ability.
- Defects: What end users see. A broken function or ability.
- Risks: What end users DO NOT see. A compliance gap (e.g., cyber security, a11y).
- Debt: What end users DO NOT see. A technical/process/people debt (e.g., architecture refactoring, new API, investment in automation)
- Business Results is what the organization ultimately cares about. In the commercial world, it would be tied to profit. But in the public sector world, it is tied to a Program’s mandate and expected result. The IT Branch can report on costs spent on the product as well in its APM Assessment. But ultimately, this metric is a business one and Program Officials are encouraged to partner with the CDO and the BAAO to help define them.
In Figure 3, we can see that the workload distribution over a 12-month period shifted from focusing on new features, to fixing defects and addressing compliance risks, to remediating technical debt.
In a product-type investment, the Product team decides this workload distribution. Greater departmental governance may intervene if necessary but the Product team uses its blanket authority to decide how best to distribute workload.
Phase 1 Implementation
Approach
The strategy’s approach in implementing product management in the department is to iterate on the framework8 by periodically evaluating it with product candidates.
These evaluations will inform the framework’s next iteration by providing it with empirical evidence of what works and doesn’t work.
To formalize engagement between stakeholders, a Branch Initiative sponsored by the DG of SABR will be used.
Phase 1 Objectives (FY 21/22 and 22/23)
- Produce MVP framework and evaluate it against 2 product candidates (one from A-Base sources of funds, the other from B-Base sources)
- Produce a programme-like activity plan (informing next round of activities and stakeholders to realize benefits)
Phase 2 Objectives (FY 23/24)
- TBD based on FY 22-23 programme-like activity plan
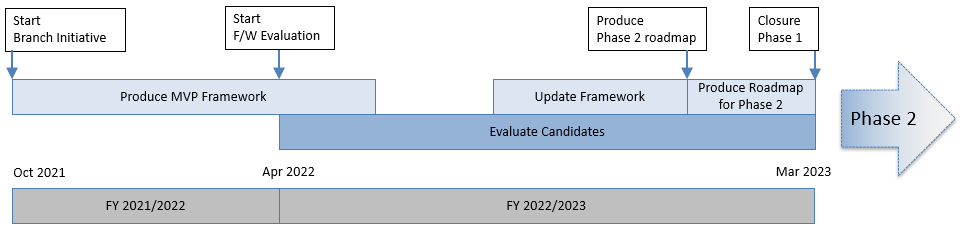 Figure 4. Phase 1 of the Strategy as a Branch Initiative.
Workstreams
The following workstreams will be worked on during Phase 1, each with their own OPI and contributors.
Objective: seek empirical evidence by evaluating 2 candidates to inform next steps
Expected Results: clearer list of activities to perform (programme-like plan) with a more accurate level of efforts
| Workstream | OPI | Contributors |
|---|---|---|
| Investment Management | CFOB EPMO | IITB BPMO, IITB RM, IITB BRM, IITB IT Strategy |
| Financial Management | IITB RM | IITB BPMO, CFOB FMAS |
| People Management | IITB HR | IITB RM, IITB SAs |
| Governance | IITB IT Strategy + CFOB EPMO | IITB BPMO, OCIO (Gov), IITB EA, IITB IM, IT Security (ATOs), IITB CM (Release Mgt) |
| Outcome Measurement | CFOB IPM (Note 1) | SSPB CDO (?), TMB BAAO (?) |
| Portfolio Management | IITB BPMO | IITB BRM, IITB RM, CFOB FMAS |
| Change Management | IITB CM&C | IITB IT Strategy |
| Coordination & Mgt of FY 22/23 initiative | IITB IT Strategy | IITB Resource Centre (?) |
Note 1: Potential link with ESDC Directive on Benefits Management
Note 2: We seek one candidate funded with A-Base source and one candidate funded with B-Base source.
Appendix A - Product Architectural Boundaries
A given Product has the following architectural boundaries, used by Enterprise Architecture to provide strategic advice:
- Business Alignment, to the Business Capability Model.
- Information Profile, defined by the following attributes:
- Privacy, manifested by a Privacy Impact Assessment (includes Retention and Disposition rules)
- Security, manifested by a Statement of Sensitivity and a Statement of Acceptable Risk
- Ethics, manifested by one or more Algorithmic Impact Assessment
- Technology Standards, defined by the following attribute:
- Unacceptable technical stacks (in containment or retirement)
Appendix B - Level of Autonomy
The level of autonomy is inspired by the CFO’s financial delegation authority and Heads of HR delegation.
The Senior ADM of the IT Branch is both the CIO and the Departmental Official Responsible for Cyber Security (DOCS). This person is accountable to 509 policy requirements. In order to have sufficient assurance that policy requirements are met, CIOs and DOCS require IM/IT changes to pass through their central corporate release process, including architecture and security assessments. To further control these processes, IM/IT staff will be located under the CIO HR organization.
A level of autonomy may be provided to product teams by delegating some authorities to them. As per the Financial and HR delegations, this is not a simple form to fill out. It is expected to require training and can have real consequences of non-compliance.
| Policy / Corporate Area | Description |
|---|---|
| Privacy | The Business ADM takes on the liability of a privacy incident for her product. Assurances involves performing a Privacy Impact Assessment and interacting with the Privacy Management Division |
| Cyber Security | The Business ADM takes on the liability of a cyber security incident for her product. Assurances involves applying ITSG-33 controls on the product proportional to the Statement of Sensitivity and Statement of Acceptable Risks exercises. |
| Ethics | The Business ADM takes on the liability of an ethics incident for her product. Assurances involves producing an Algorithmic Impact Assessment and meeting the Directive on Automated Decision Making requirements. |
| Production Release | The Business ADM takes on the liability of releasing her product in production by following ESDC’s Software Release Process (as per ITSM). The CIO may establish a “capped size” for releases (to protect limited network bandwidth on premise and greater ESDC reputation) |
| Corporate Services | The Business ADM funds its own IT corporate services to function, including production and incident management operations |
Note 1: A delegation of all areas would indicate more than one CIO and DOCS reporting to the Deputy Head. Highly unlikely.
Note 2: A delegation in one area grants a Business ADM the ability to embed personnel of that area under its HR Org structure.
Note 3: Production Release process maps to the IITB SDLC. Quality Assurance ensures that the right stakeholders were involved throughout the s/w lifecycle before releasing to production.
Note 4: Corporate services include Funding for Cyber Security Operation Centre (CSOC), IT Security Assessment, Cloud Operations, Architecture Review, Service Desk, Laptops, VPNs.
Appendix C - Product Life Cycle Overview
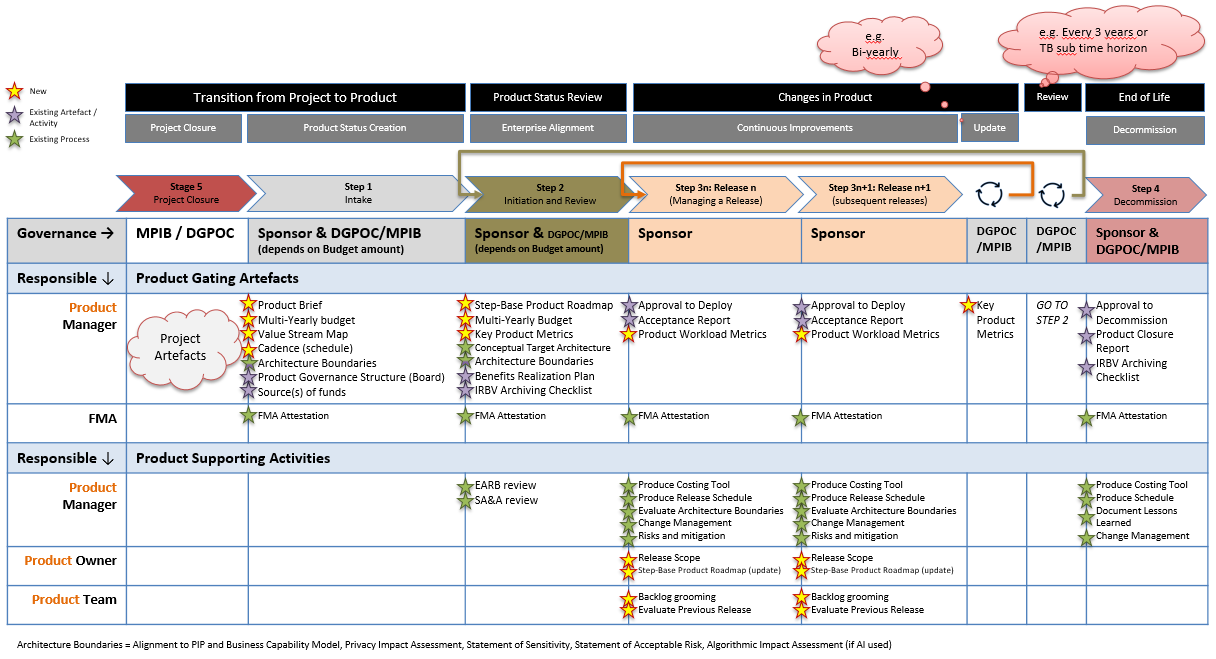 Figure 5. Overview of the Proposed Product Lifecycle
Appendix D - Portfolio Management, a CFO’s perspective
The CFO allocates a budget to a portfolio based on departmental priorities, for a given time horizon (multi-year) Within the portfolio, the Program Official distributes her funds to products according to the portfolio’s own priorities.
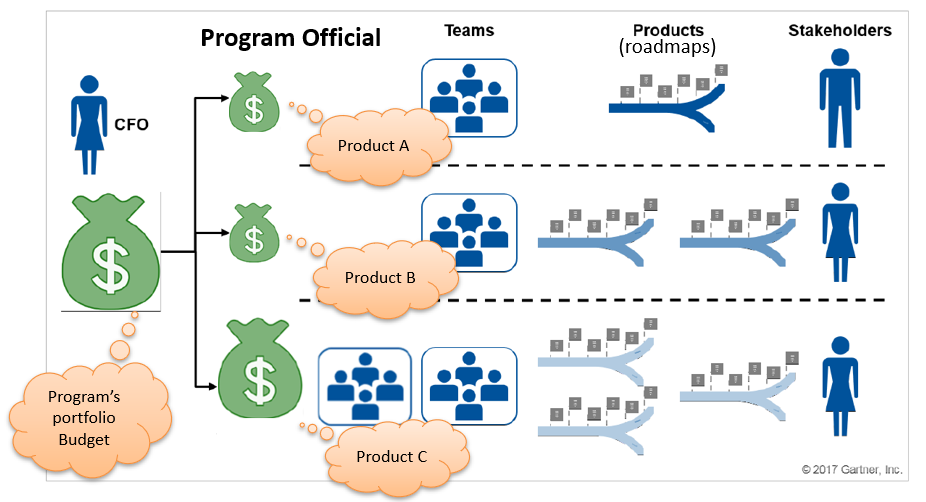 Figure 6. Budget and funding distribution within a portfolio
Appendix E - Value Stream Mapping
Value Stream Mapping are about the individuals, irrelevant of where they fit within the org structure, that are part of the product delivery and operation (a grouping of cross-functional teams).
Handoffs greatly reduced if all individuals are under a single “Product Manager”
Value Stream Mapping for software delivery is an implementation of the IITB SDLC
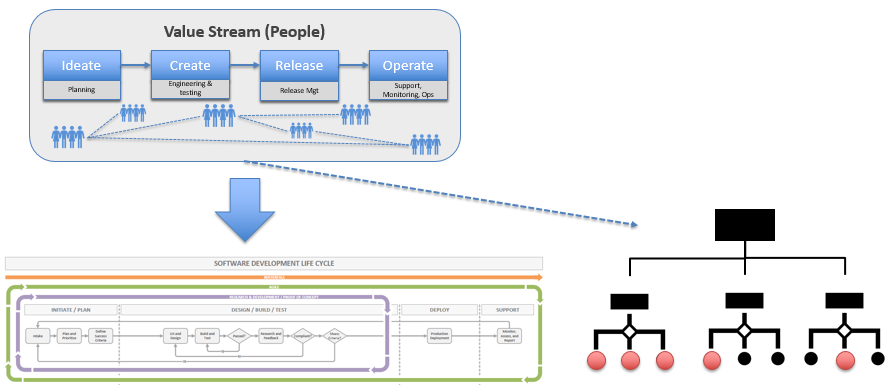 Figure 7. Value Stream Mapping for Software Delivery
Appendix F - IT’s Financial Model
IT’s financial model needs adjustments as it moves towards product-based funding. In some cases, different work on a product may be financed by different programs (e.g. A Benefits business rules funded by Employment Insurance).
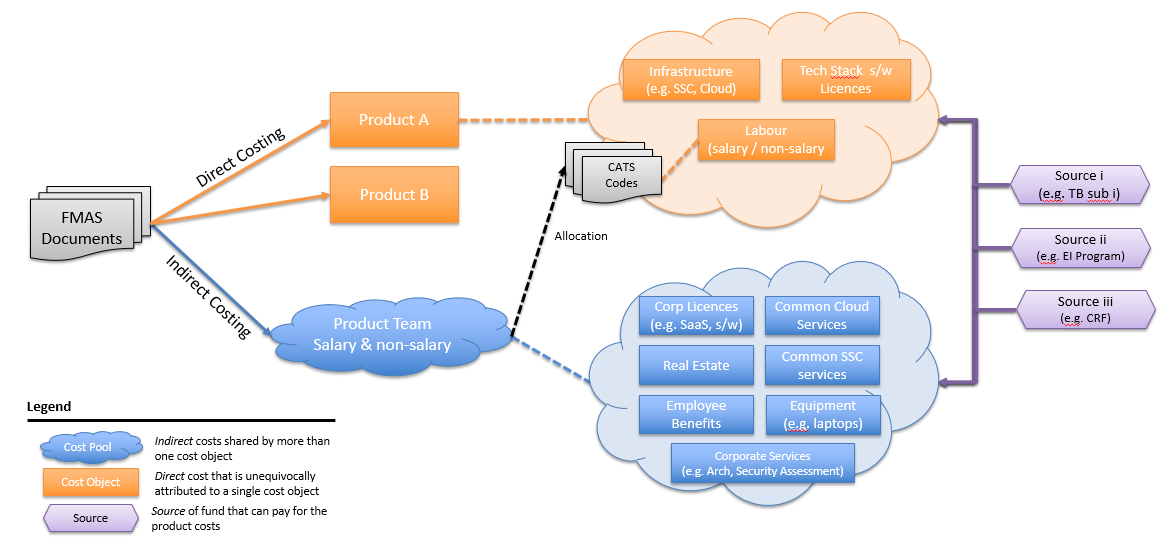 Figure 8. IT Financial Model for Product Management
Appendix G - Terms and Definitions
| Term | Definition |
|---|---|
| a11y | Accessibility |
| AIA | Algorithmic Impact Assessment |
| APM | Application Portfolio Management |
| BAAO | Business Architecture Alignment Office |
| BPMO | Branch Project Management Office |
| BRM | Business Relations Management |
| CDO | Chief Data Office |
| CFOB | Chief Financial Officer Branch |
| DGPOC | Director General Project Oversight Committee |
| DRF | Departmental Results Framework |
| EPMO | Enterprise Project Management Office |
| FMAS | Financial Management and Advisory Services |
| IITB | Innovation and Information Technology Branch |
| IPM | Investment and Performance Management |
| MPIB | Major Project and Investment Board |
| OPI | Office of Primary Interest |
| PIA | Privacy Impact Assessment |
| RM | Resource Management |
| SAR | Statement of Acceptable Risk |
| SAs | Senior Advisors |
| SoS | Statement of Sensitivity |
| TB | Treasury Board |
| TBS | Treasury Board Secretariat |
| TMB | Transformation Management Branch |
Appendix H - Change Log
| Version | Date of Change | Change Description |
|---|---|---|
| 0.01 | 2021-07-30 | First Draft, moved from working document to web page |
| 0.02 | 2021-10-04 | Updates based on internal discussions |
Notes
-
ESDC currently recognizes 3 types of investment: assets, acquired services, and projects (see ESDC’s Guide to building a Business Case) ↩
-
Framework = a directive, a set of standards (e.g., reporting), and a set of procedures (e.g., manoeuvring governance) ↩
-
The main areas of the CFO’s domain expertise are Enterprise Project Management, Financial Management, and Investment Performance Management. ↩
-
The main areas of the CIO’s domain expertise are Project Management Office, Release Management (and ITSM), IT Security, and Enterprise Architecture. ↩
-
See this inventory of 38 known definitions from industry and government. ↩
-
cATOs are inspired by the US Air Force’s Platform One team, in the Chief Software Office. NIST and ITSG-33 do not have continuous types of controls. Will need to innovate while remaining in compliance. ↩
-
Framework = a directive, a set of standards (e.g., report requirements), and a set of procedures ↩